Accounting Modes
Our Accounting Modes are settings within the platform that determine when conversion and revenue credit are given.
What are Accounting Modes?
| Accounting Mode | What is it best for? | Definition | Use Cases | Example Scenarios to Best Leverage |
|---|---|---|---|---|
| Cash Snapshot | Best for Reporting Purposes. | Attribute Credit to the Day of the Transactions. | Measuring business cash flow; MER | 1. Which was the weekly/ monthly/ quarterly impact of all my channels on the business? 2. We had a really strong revenue day yesterday. Which channels contributed to the success? _ |
| Accrual Performance | Best for Daily Optimizations. | Attribute Credit to the Day of the Interaction. | Scaling paid media; CAC/ROAS | 1. _What campaign/ asset/ ad has been performing the best over the past 7 days? 2.We're seeing a drop in performance over the past 7 days, which channel is falling behind? |
They're named to roughly mirror cash basis vs. accrual accounting in corporate finance.
Here are how the two modes differ:
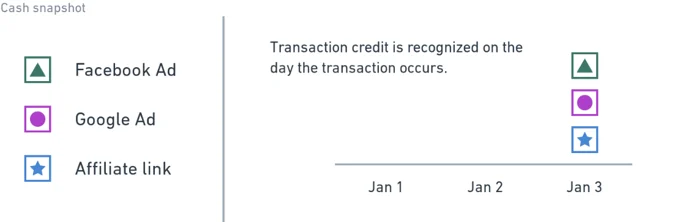
What is Cash Snapshot?
In Cash Snapshot, revenue and transactional credit are given when a transaction occurs, or when an order was placed.
Cash Snapshot is useful for understanding the amount of money coming in on any given day (cash flow).
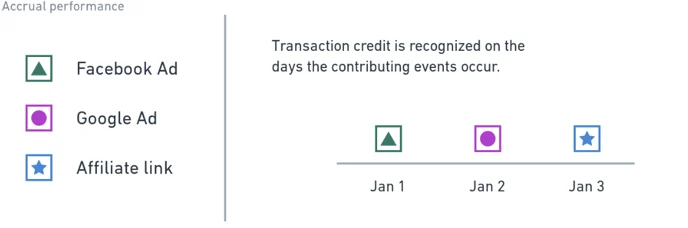
What is Accrual Performance?
In Accrual Performance, revenue and transactional credit are given when a contributory marketing touchpoint occurs.
Marketing touchpoints refer to any interaction that results in a website visit, which triggers our Northbeam Pixel
Examples:
- Click on an Ad that lands on your site
- Click on an Email or SMS message that lands on your site
- Click on an Influencer link that lands on your site
- Click on an Affiliate link that lands on your site
- Click on an Organic Search link that lands on your site
- Click on an Organic Social link that lands on your site
- Direct Visit that lands on your site
In Conclusion:
Accrual Performance is meant to help understand the direct return of your marketing dollars and designed to show the full impact of marketing channels on your business.
Example: The difference between Cash Snapshot and Accrual Performance Accounting Modes
Let's say Dan visits the "Widgets Co" website on three different days:
- Jan 1 - site visit from clicking on a Facebook Ad
- Jan 2 - site visit from clicking on a Google Ad
- Jan 3 - site visit after clicking on an affiliate link and placed a $90 order
For simplicity, let's suppose we're using an equal-weight attribution model where all marketing channels receive equal credit (i.e. Linear attribution model), so the Facebook Ad, the Google Ad, and the affiliate link each get 1/3 credit for the purchase.
In Cash Snapshot mode:
All revenue and transactional credit is given to Jan 3 since the order was placed on Jan 3.
Here's a breakdown of the credit allocation:
| Jan 1 | Jan 2 | Jan 3 | |
|---|---|---|---|
| Facebook Ad | $0 revenue; 0 transactions | $0 revenue; 0 transactions | $30 revenue; 0.33 transactions |
| Google Ad | $0 revenue; 0 transactions | $0 revenue; 0 transactions | $30 revenue; 0.33 transactions |
| Affiliate Link | $0 revenue; 0 transactions | $0 revenue; 0 transactions | $30 revenue; 0.33 transactions |
What does this mean?
All credit is given to Jan 3. Zero credit given to Jan 1 and 2, despite the touchpoints that occurred on these days.
As a result, it's easy to assume Jan 1 and 2 didn't have an influence on the purchase.
To take it one step further, let's say $10 was spent on Facebook and Google on each day. Your data would look like something like this.
Jan 1 Performance
| Spend | Revenue | MER | |
|---|---|---|---|
| Facebook Ad | $10 | $0 | 0.0 |
| Google Ad | $10 | $0 | 0.0 |
| Affiliate Link | $0 | $0 | 0.0 |
Jan 2 Performance
| Spend | Revenue | MER | |
|---|---|---|---|
| Facebook Ad | $10 | $0 | 0.0 |
| Google Ad | $10 | $0 | 0.0 |
| Affiliate Link | $0 | $0 | 0.0 |
Jan 3 Performance
| Spend | Revenue | MER | |
|---|---|---|---|
| Facebook Ad | $10 | $30 | 3.0 |
| Google Ad | $10 | $30 | 3.0 |
| Affiliate Link | $0 | $30 | - |
How this could be misleading when scaling media:
- Jan 1 and 2 received no revenue credit, with 0.0 MER, so it's easy to assume these days had poor performance
- Jan 3 received all the credit, with 3.0 MER, so it's easy to assume this day had great performance
This potential misleading effect is magnified if your brand has a longer purchase conversion cycle.
Suppose you're selling a higher AOV product and it takes roughly 30 days for a customer to convert. Today's ad performance on Cash Snapshot mode could be a result of marketing efforts from up to 30 days ago.
Pro Tip: Most Ad Managers report their numbers using the Cash Snapshot mode.
In Accrual Performance mode:
Revenue and transactional credit is divided between Jan 1, 2, 3 and assigned to the touchpoints that resulted to the site visits.
Here's a breakdown of the credit allocation:
| Jan 1 | Jan 2 | Jan 3 | |
|---|---|---|---|
| Facebook Ad | $30 revenue; 0.33 transactions | $0 revenue; 0 transactions | $0 revenue; 0 transactions |
| Google Ad | $0 revenue; 0 transactions | $30 revenue; 0.33 transactions | $0 revenue; 0 transactions |
| Affiliate Link | $0 revenue; 0 transactions | $0 revenue; 0 transactions | $30 revenue; 0.33 transactions |
Keep in mind:
Accrual is our most popular accounting mode since credit is given to the different marketing touchpoints, which gives the most accurate view of ad performance.
With this in mind, the Overview and Sales page in our dashboard default to Accrual accounting mode.
Cash Snapshot - Use Cases
Use Case 1: Goal Setting Based on Blended MER
Many brands track their company's performance using a target MER Goal, as MER typically points to profitability.
For context, MER is calculated the same way as ROAS (Total Revenue / Total Spend), but the difference is that MER is used in Cash Snapshot mode, while ROAS is used in Accrual Performance mode.
Why is MER used in Cash accounting, while ROAS is used in Accrual accounting?
It boils down to the accounting modes. We know Cash Snapshot does not attribute the orders and transactions to the contributory touchpoints. While the same formula is used (Revenue/Spend), we merely see it as a ratio, also known as Media Efficiency Ratio (MER).
On the other hand, we attribute orders and transactions to the touchpoints in Accrual accounting. Therefore, we see (Revenue/Spend) in Accrual accounting as more of a true return on your ad spend (ROAS).
Now, we can use a Blended MER goal to track business-level performance.
To take it one step further, a Blended MER can waterfall down into lower-level ROAS or CAC goals at the platform levels. In this context, Blended MER refers to MER across all channels: total revenue / total spend.
Let's say your Blended MER goal was a 3.0 and looking at your historical data, you saw the following:
| Blended MER | Facebook ROAS (1DC) | Google ROAS (1DC) | TikTok ROAS (1DC) |
|---|---|---|---|
| 3.5 | 1.2 | 2.5 | 0.8 |
| 3.0 | 1.0 | 2.2 | 0.6 |
| 2.5 | 0.8 | 1.9 | 0.4 |
| 2.0 | 0.6 | 1.8 | 0.2 |
We can use the benchmarks for Facebook, Google, and TikTok when tracking performance using the Accrual accounting mode. In fact, we have a Benchmarking Tool that helps you do this within the Sales page.
Updated 3 months ago