Attribution Models
Our Attribution Models are one of the most important concepts to understand.
Our Attribution Models assign credit for conversion events to relevant marketing touchpoints.
Northbeam offers 6 different attribution models, which are divided into two categories: Simple Attribution Models and Multi-Touch Attribution Models (MTA).
- Simple Attribution Models
- Multi-Touch Attribution Models
- Linear
- Clicks-Only
- Clicks+Modeled Views, formerly known as Clicks+Views
Simple Attribution Models
In Simple Attribution Models, all credit is given to a single touchpoint. These are legacy models that you may be used to seeing.
Here are our simple models:
- First Touch
- Last Touch
- Last Non-Direct Touch
Please Note
Last Non-Direct Touch is the default model used by most in-platform reporting (Facebook Ads, Google Ads, TikTok Ads, Pinterest Ads, Klaviyo, Attentive, etc.) and Google Analytics.
Multi-Touch Attribution Models (MTAs)
In Multi-Touch Attribution Models, credit is divided across multiple touchpoints.
Here are our multi-touch models:
- Linear
- Clicks-Only
- Clicks + Modeled Views
Proprietary Models
Clicks-Only and Clicks + Modeled Views are Northbeam's proprietary models. Learn more below.
Summary of Northbeam's Attribution Models
| Attribution Model | Data Source | Credit Allocation | High-Level Use Case |
|---|---|---|---|
| First Touch | Hard click data | Full credit is given to the First touchpoint | Understanding the impact of Upper Funnel channels. |
| Last Touch | Hard click data | Full credit is given to the Last touchpoint | Understanding the impact of your Lower Funnel channels. |
| Last Non-Direct Touch | Hard click data | Full credit is given to the Last touchpoint, excluding Direct visits. | Understanding the impact of your Lower Funnel channels. |
| Linear | Hard click data | Credit is divided equally among all touchpoints | Understanding the impact of All channels using an MTA model, where everything is weighted equally. |
| Clicks-Only | Hard click data | Credit is divided equally among all touchpoints, excluding lower funnel touchpoints | Understanding the impact of Upper Funnel channels, with emphasis given to Upper Funnel |
| Clicks + Modeled Views | Hard click data AND Machine learning Modeling | Two parts: (1) Clicks-Only (2) NB's proprietary View-model | Understanding the impact of Upper Funnel channels, with even more emphasis given to Upper Funnel. |
First Touch
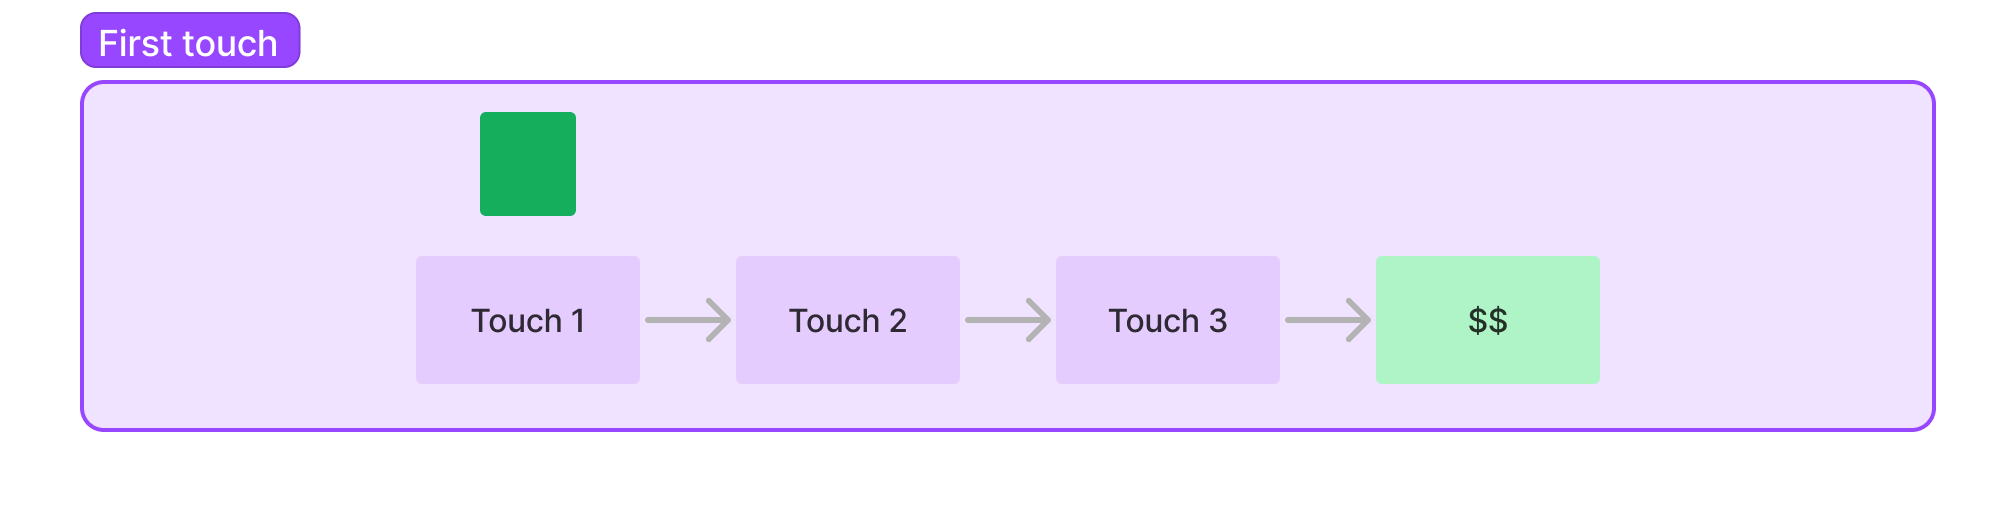
When to Use First Touch: Anytime you want to give credit to the very first touchpoint (ie, subscriptions, or gut checking MTA data). In this model, full credit is given to the first touchpoint of the customer journey.
Last Touch and Last Non-Direct Touch
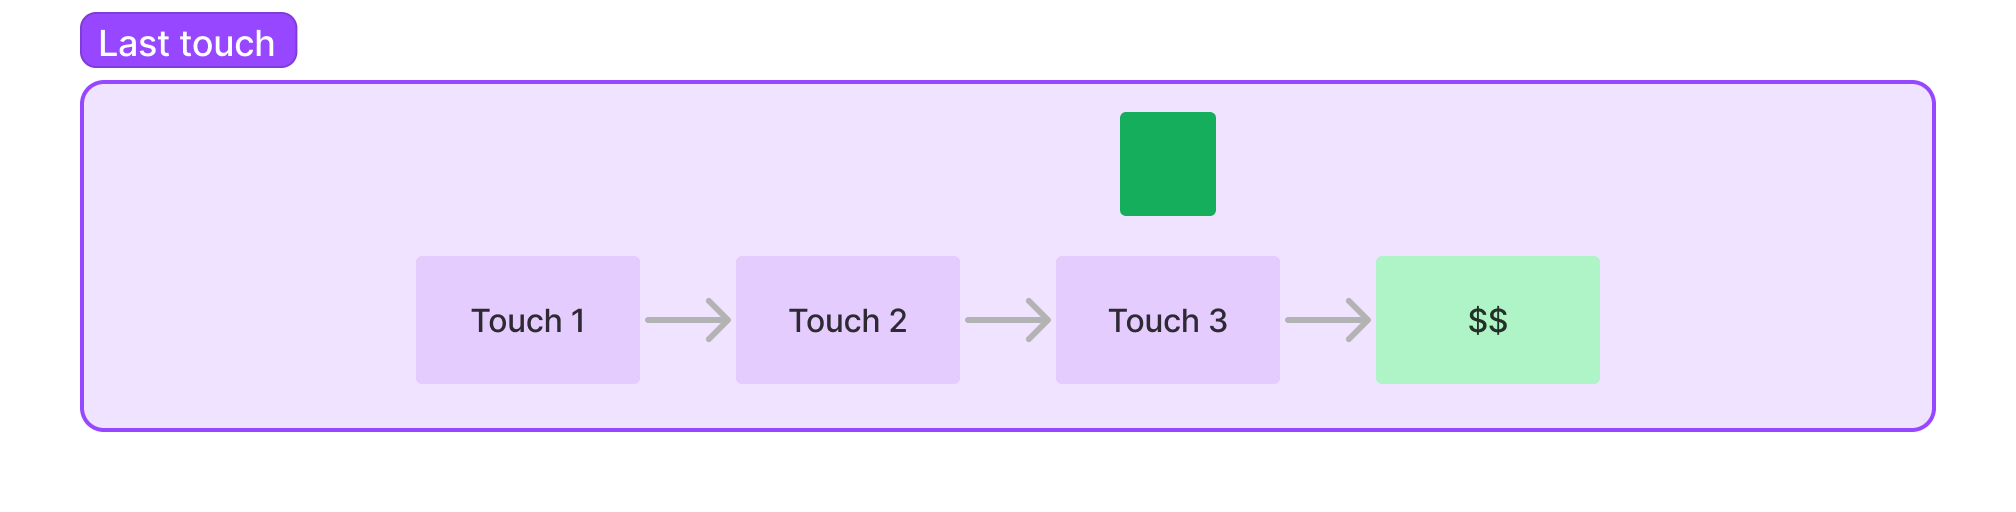
When to use Last Touch: This is the least-used model in our system, but its great for reviewing lift in direct traffic or performance over time.
When to use Last Non-Direct Touch: This model compares consistently well with Google Analytics' "Last Click" and is a strong number to compare to ground data in a familiar environment. It is also great for monitoring Bottom of Funnel performance.
In these models, full credit is given to the last touchpoint of the customer journey, but Last Non-Direct Touch does not give credit to Direct if it is the final touchpoint.
As an example, let's take the following customer journey that resulted in a $90 order.
| Revenue Credit using Last Touch | Revenue Credit using Last Non-Direct Touch | |
|---|---|---|
| Jan 1 - Facebook Click | $0 | $0 |
| Jan 2 - Google Click | $0 | $90 |
| Jan 3 - Direct Visit | $90 | $0 |
This model is great to understand the impact of your lower funnel channels — Branded Search, Organic Search, and Email/SMS to name a few.
Linear
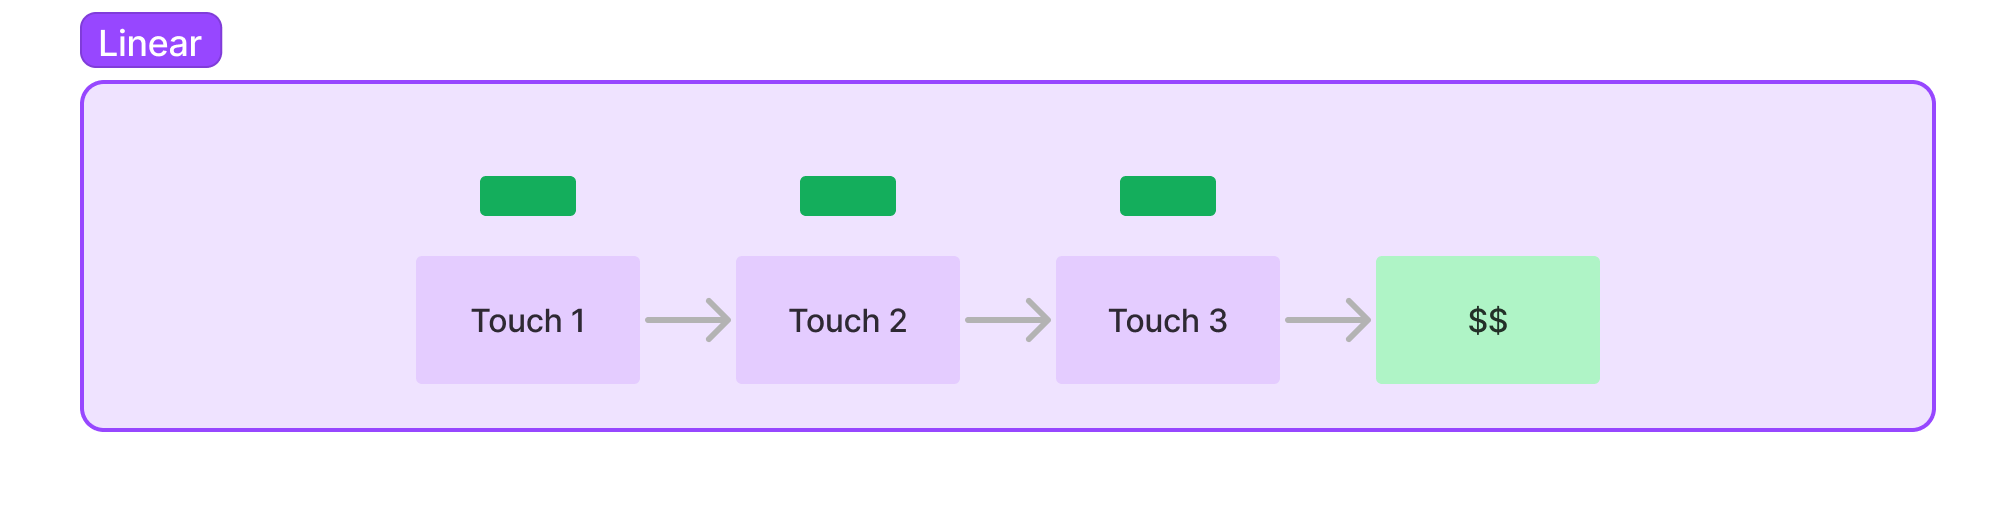
When to use Linear: Typically for channels that are in the middle of the funnel (i.e. organic social).
Linear divides credit equally across all channels.
Clicks-Only
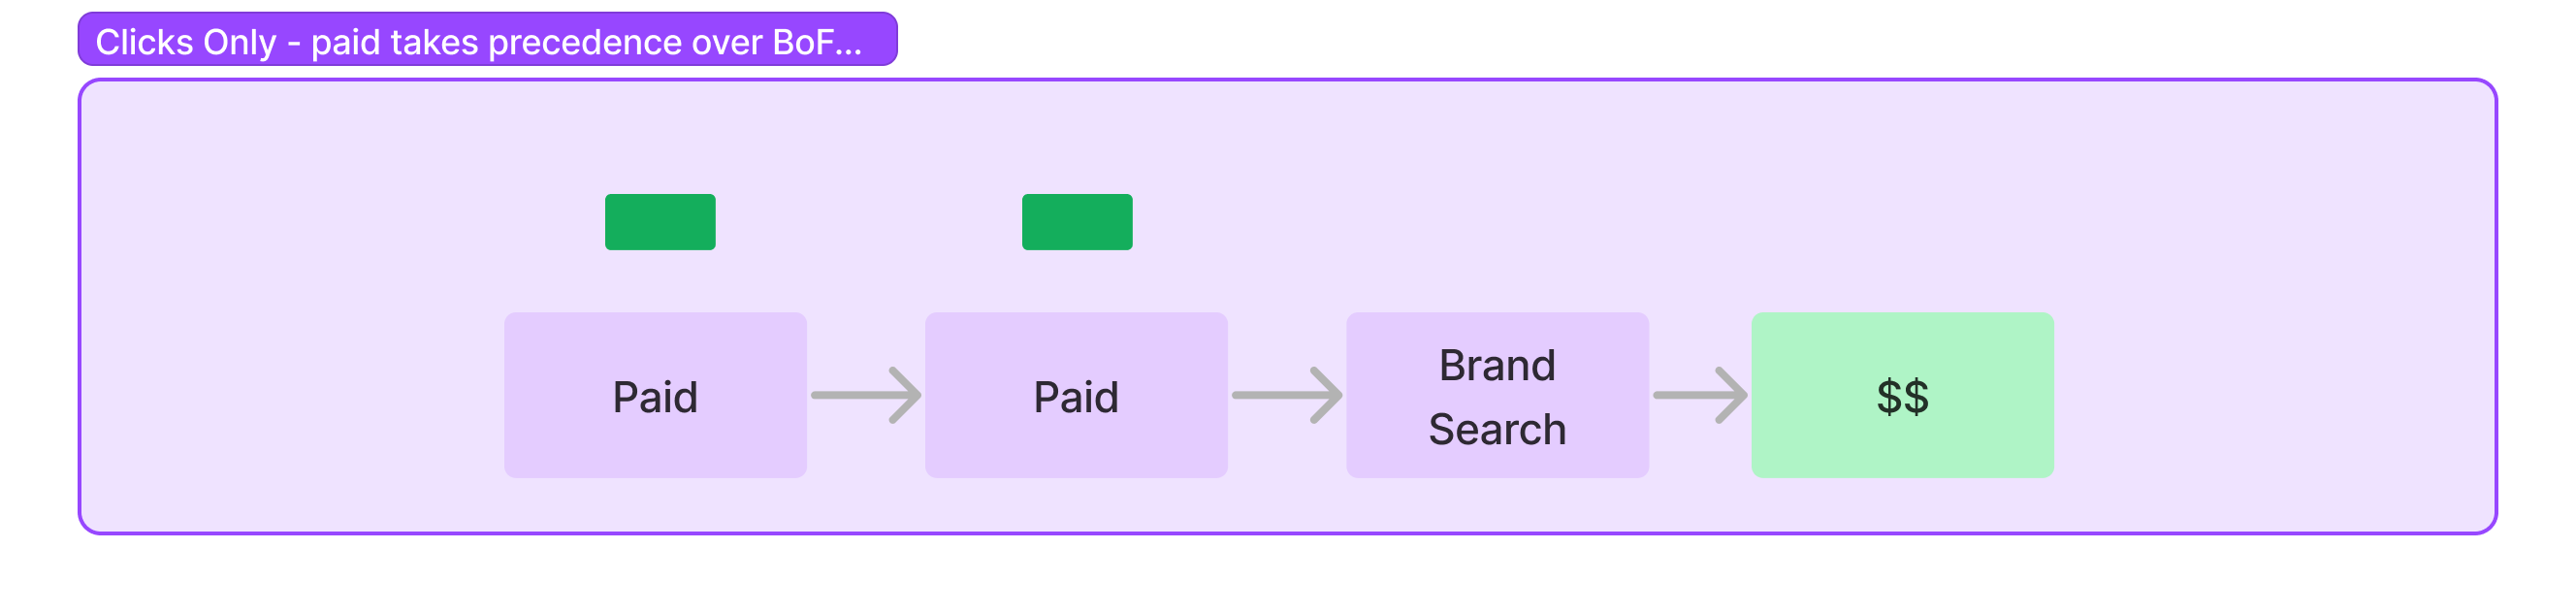
When to use Clicks-Only: Great for day-to-day decision making. This will be more conservative, but makes for a very useful prospecting compass.
This proprietary model is similar to linear, where credit is divided equally between all touchpoints.
Difference between Clicks-Only and Linear
Generally speaking, Clicks-Only is similar to Linear, but gives an emphasis to your Upper Funnel channels.
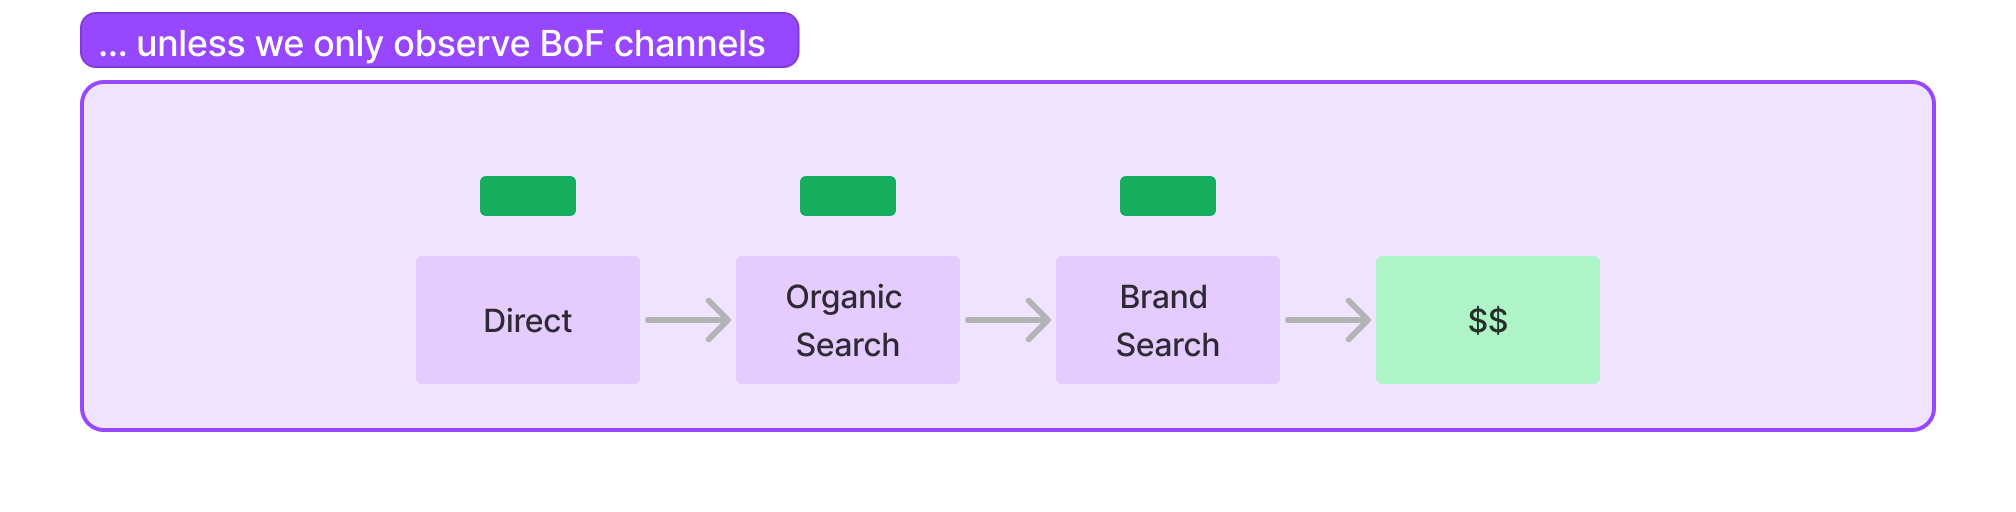
In Clicks-Only, credit is not given to Lower Funnel touchpoints if there are Upper Funnel touchpoints in the journey. The only instance where Lower Funnel touchpoints receive credit is if there are no Upper Funnel touchpoints in the journey.
You may be asking yourself:
- "What's an Upper Funnel Touchpoint?"
- "What's a Lower Funnel Touchpoint?"
- "How does the credit allocation work?"
- "Why isn't credit given to Lower Funnel Touchpoints?"
Let's dive in to your questions:
What are Upper Funnel and Lower Funnel channels?
Lower Funnel Channels
- Direct Visits (Labeled as "Organic" in the dashboard)
- Organic Search
- Paid Branded Search
- Email or SMS
Upper Funnel Channels
- Any channel that is NOT a lower funnel channel (ex. Paid Social, Paid Search (excluding Brand), PMax, Organic Social, Affiliate, Influencer, Display, etc)
Please Note
We understand these "Upper Funnel" channels may not always be used to grow the top of the funnel in your particular media strategy.
Clicks-Only: Example 1
Let's take the following journey and assume we're on the Accrual accounting mode, where credit is given to the following touchpoints.
- Jan 1 - Facebook Ad click
- Jan 2 - TikTok Ad click
- Jan 3 - Google Branded Search Ad click, resulting in a $90 purchase.
| Jan 1 | Jan 2 | Jan 3 | |
|---|---|---|---|
| Facebook Ad | $45 revenue; 0.5 transactions | $0 revenue; 0 transactions | $0 revenue; 0 transactions |
| TikTok Ad | $0 revenue; 0 transactions | $45 revenue; 0.5 transactions | $0 revenue; 0 transactions |
| Google Branded Search Ad | $0 revenue; 0 transactions | $0 revenue; 0 transactions | $0 revenue; 0 transactions |
Explanation: Although the Branded Search pushed the conversion, Branded Search does not get credit with Clicks-Only because this is a Lower Funnel Channel. Therefore, credit is distributed equally to Facebook and TikTok.
Clicks-Only: Example 2
Here's another example. Let's say the entire journey is made up of Lower Funnel Touchpoints:
- Jan 1 - Google Branded Search Ad click
- Jan 2 - Direct Visit
- Jan 3 - Email click, resulting in a $90 purchase.
| Jan 1 | Jan 2 | Jan 3 | |
|---|---|---|---|
| Google Branded Search Ad | $30 revenue; 0.3 transactions | $0 revenue; 0 transactions | $0 revenue; 0 transactions |
| Direct Visit | $0 revenue; 0 transactions | $30 revenue; 0.3 transactions | $0 revenue; 0 transactions |
| $0 revenue; 0 transactions | $0 revenue; 0 transactions | $30 revenue; 0.3 transactions |
Explanation: Because all the touchpoints are Lower Funnel, credit is distributed evenly. Credit is only pulled when an Upper Funnel touchpoint is recognized in the journey.
Why is Clicks-Only Useful?
Clicks-Only Puts Emphasis on Upper Funnel Channels
The whole idea of Clicks-Only is to see the directional impact of your Upper Funnel channels, as this is where budget is normally controlled and where businesses scale.
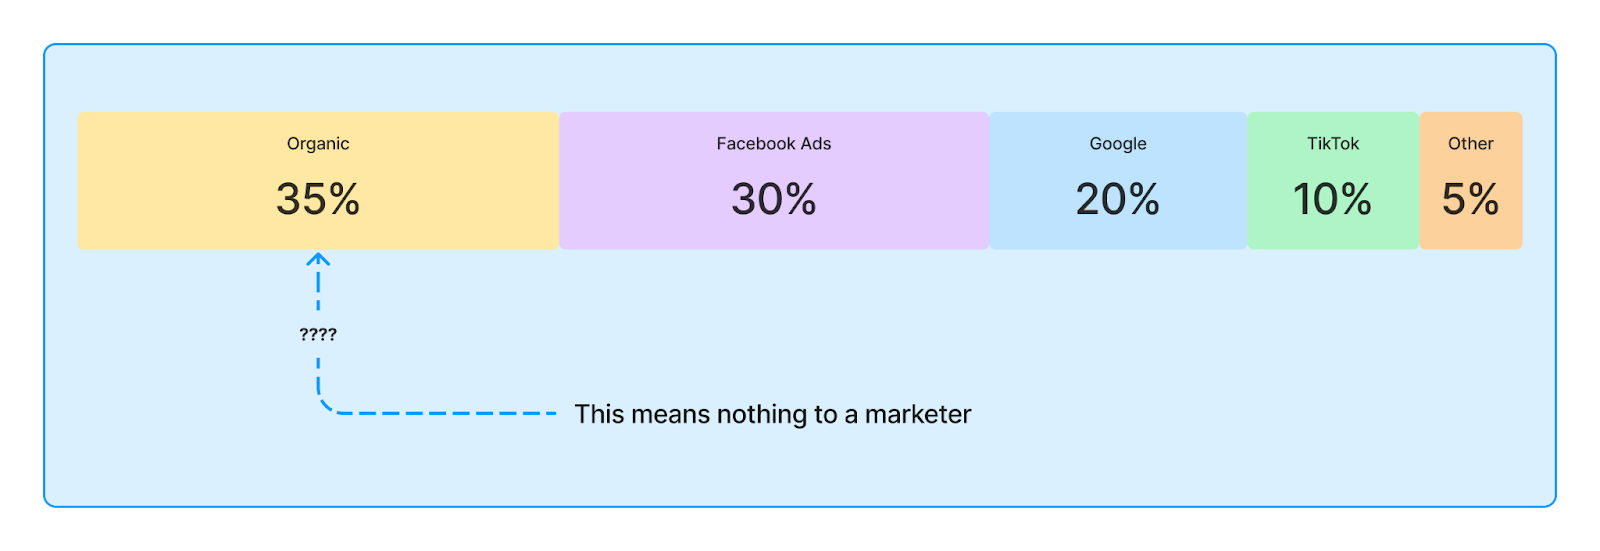
Let's say there are 50 conversions attributed to a Lower Funnel channel like Branded Search. That's normally great to see, Branded Search is likely doing its job and cleaning purchase journeys. The challenge lies in its actionability. In other words, this channel usually isn't super actionable, particularly from a media buying or budget adjustment standpoint. It's normally difficult to scale lower funnel channels due to their finite audience. As a matter of fact, these conversions are usually a result of an Upper Funnel Channel touchpoint. Therefore, by moving the credit up the funnel, we're able to pull the curtain back and see what actually drove the conversion.
Clicks-Only is Conservative
Clicks-Only is strictly based on hard click data — like all the other models, except for Clicks + Modeled Views. What we mean by this is that we're only attributing conversions that resulted in a click from a referring channel or campaign. We're not doing any modeling, unlike in Clicks + Modeled Views. We also divide credit between the touchpoints, resulting in an even more conservative view.
The upside here is that it's very directionally accurate. If a channel or campaign has strong performance in Click-Only, there's normally strong conviction that it's driving incremental revenue for your business.
Clicks + Modeled Views
Our Northbeam attribution models leverage machine learning to ingest your data and stitch together customer journeys so you can start accounting for view-through data when analyzing attribution decisions.
Clicks + Modeled Views provides directionality on which ads within a channel are driving the most results and which ones are ineffective.
Utilizing the Clicks + Modeled Views model in conjunction with Northbeam’s Clicks-Only attribution model can help you fill in any “click-through” gaps, particularly for channels like Social and Video that are highly view-oriented.
What exactly is the Clicks + Modeled Views Attribution Model?
Clicks + Modeled Views is Northbeam’s proprietary machine learning model that accounts for impression and ad engagement data when making attribution decisions. This model looks to split attribution credit on a multi-touch basis.
it reduces attribution credit to any direct, organic search, paid branded search, or email/SMS touchpoints in the customer's journey, and gives appropriate credit to Views at any point throughout the customer's journey.
Note: View-Through data measures how many visitors saw your ad but did not click.
We built this model because unattributed traffic is not helpful for marketers when trying to analyze which channels are powering their highest-converting paths. Although our Clicks-Only model is our most accurate model because clicks are hard data, there are many conversions that won’t be captured: clicks don’t represent the entire picture.
We understand that many customers eventually convert via direct visits after watching a TikTok, YouTube, or Facebook ad. This is why our Clicks + Modeled Views model tries to assign proper credit to any ad views throughout a conversion path. This can help make your data actionable by giving you a more complete picture of what’s going on with your campaigns.
How does Clicks + Modeled Views work?
At a high level, our model tracks engagement metrics (impressions, video views, etc.) and looks for correlations between those metrics and any corresponding organic spikes. Our model then makes an educated guess using machine learning to assign organic traffic and conversions to the ad campaign that were mostly likely to prompt that behavior.
Please note the attribution window for Clicks + Modeled Views is 1 day view only, regardless of which option you select.

When do you use Clicks + Modeled Views?
Keep in mind, our Clicks + Modeled Views model takes 25-30 days to "learn" from the historical data collected by our tracking pixels.
One of the most common questions we get is: Which attribution model is the best one to use to make media buying decisions?
The answer is: Clicks + Modeled Views offers directionality of which views are driving incremental revenue.
Look for big gaps between revenue reported in Clicks Only vs. Clicks + Modeled Views to better understand what assisted organic conversions.
We recommend using the Model Comparison tool in Northbeam to do this via the hamburger icon on the top right of your Northbeam dashboard next to the maintenance alerts icon.
Let’s say you notice that Clicks + Modeled Views captures a revenue attributed to YouTube ads that weren’t captured in Clicks Only. This could mean that YouTube ads are driving revenue, but we should try and validate these results before dramatically scaling spend.
One way to do that is to conduct post-purchase surveys and track where incremental revenue is coming from. You could also slowly ramp up spend on YouTube while keeping an eye on blended revenue numbers to see if they’re highly correlated. If post-purchase surveys are also indicating YouTube as a leading channel, then you can be reasonably confident that YouTube ads are having a positive and additive impact on your business.
What is the benefit of looking at the Clicks + Modeled Views model?
Ultimately, the Clicks + Modeled Views can help you better allocate your marketing dollars. You spend less on conversion ads if more people view them, don’t click, and then later purchase.
It is great for understanding the full impact of prospecting performance, and also useful for monthly reporting on prospecting channels.
Updated 14 days ago